01
Stay inside permit conditions
Limits are set per project in the platform and judged on the same 24-hour averages the authority uses. You see how far each station sits from its limit before an exceedance becomes a notice.

GCEEC supplies, installs and commissions the monitoring stations. The platform turns their readings into live dashboards, threshold alerts and the compliance reports your environmental permit asks for, without a technician visiting the site to collect data.
Environmental permits in the UAE and wider GCC routinely require particulate monitoring at the boundary of earthworks, crushing, batching and material-handling operations. Periodic grab sampling shows one hour of a month. Continuous monitoring shows all of it, and proves what happened when a complaint or inspection arrives.
Limits are set per project in the platform and judged on the same 24-hour averages the authority uses. You see how far each station sits from its limit before an exceedance becomes a notice.
A rule that holds for the duration you set fires an alert to the dashboard and the channels you choose. The site team can wet down, pause a crusher or close a gate in minutes, not after the weekly report.
Every reading is time-stamped and kept per device. When a neighbour, consultant or inspector asks about a specific afternoon, you export that window in seconds instead of reconstructing it.
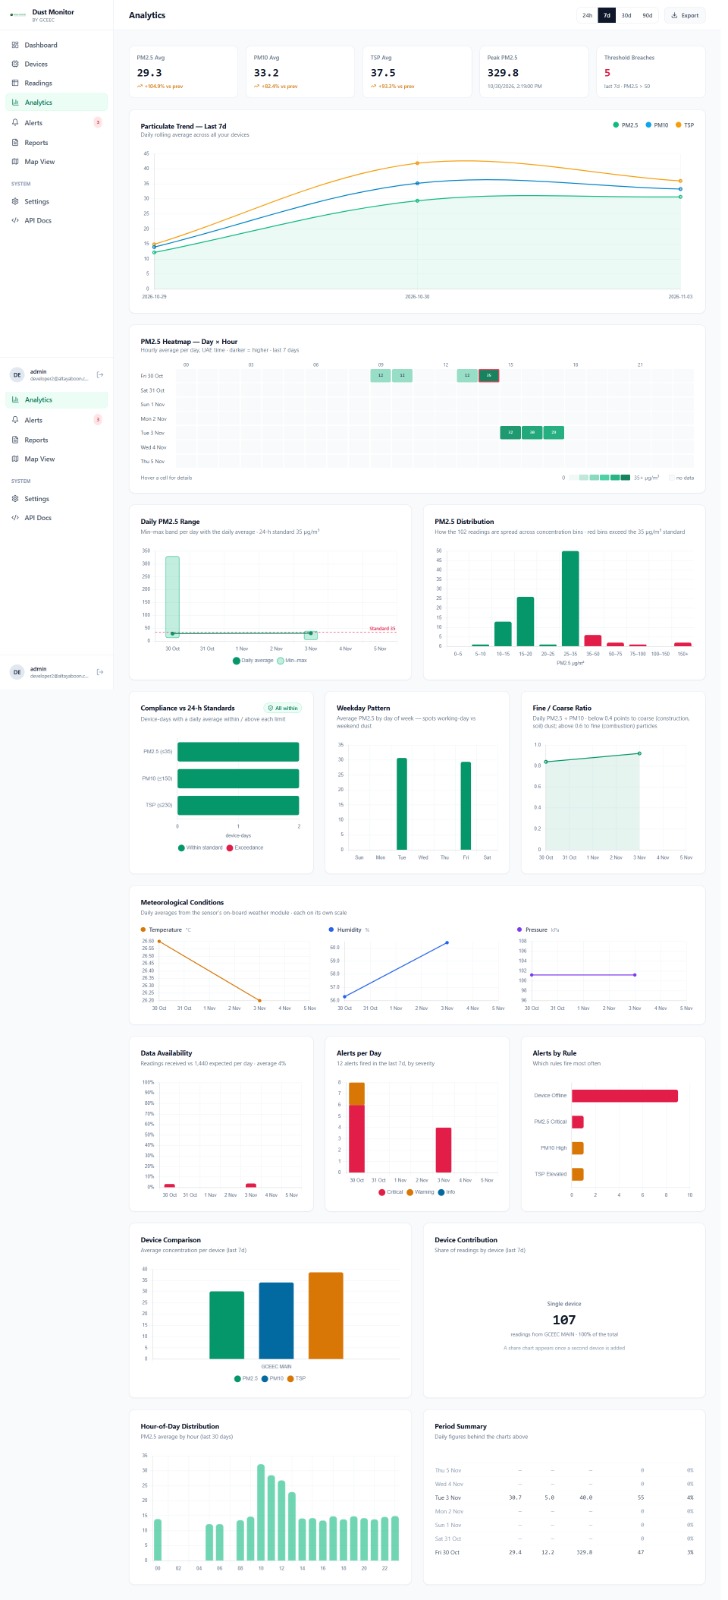
PM2.5 and PM10 are the fractions that reach the lungs. Hour-of-day and day-of-week analytics show which activities drive exposure so controls go where they matter.
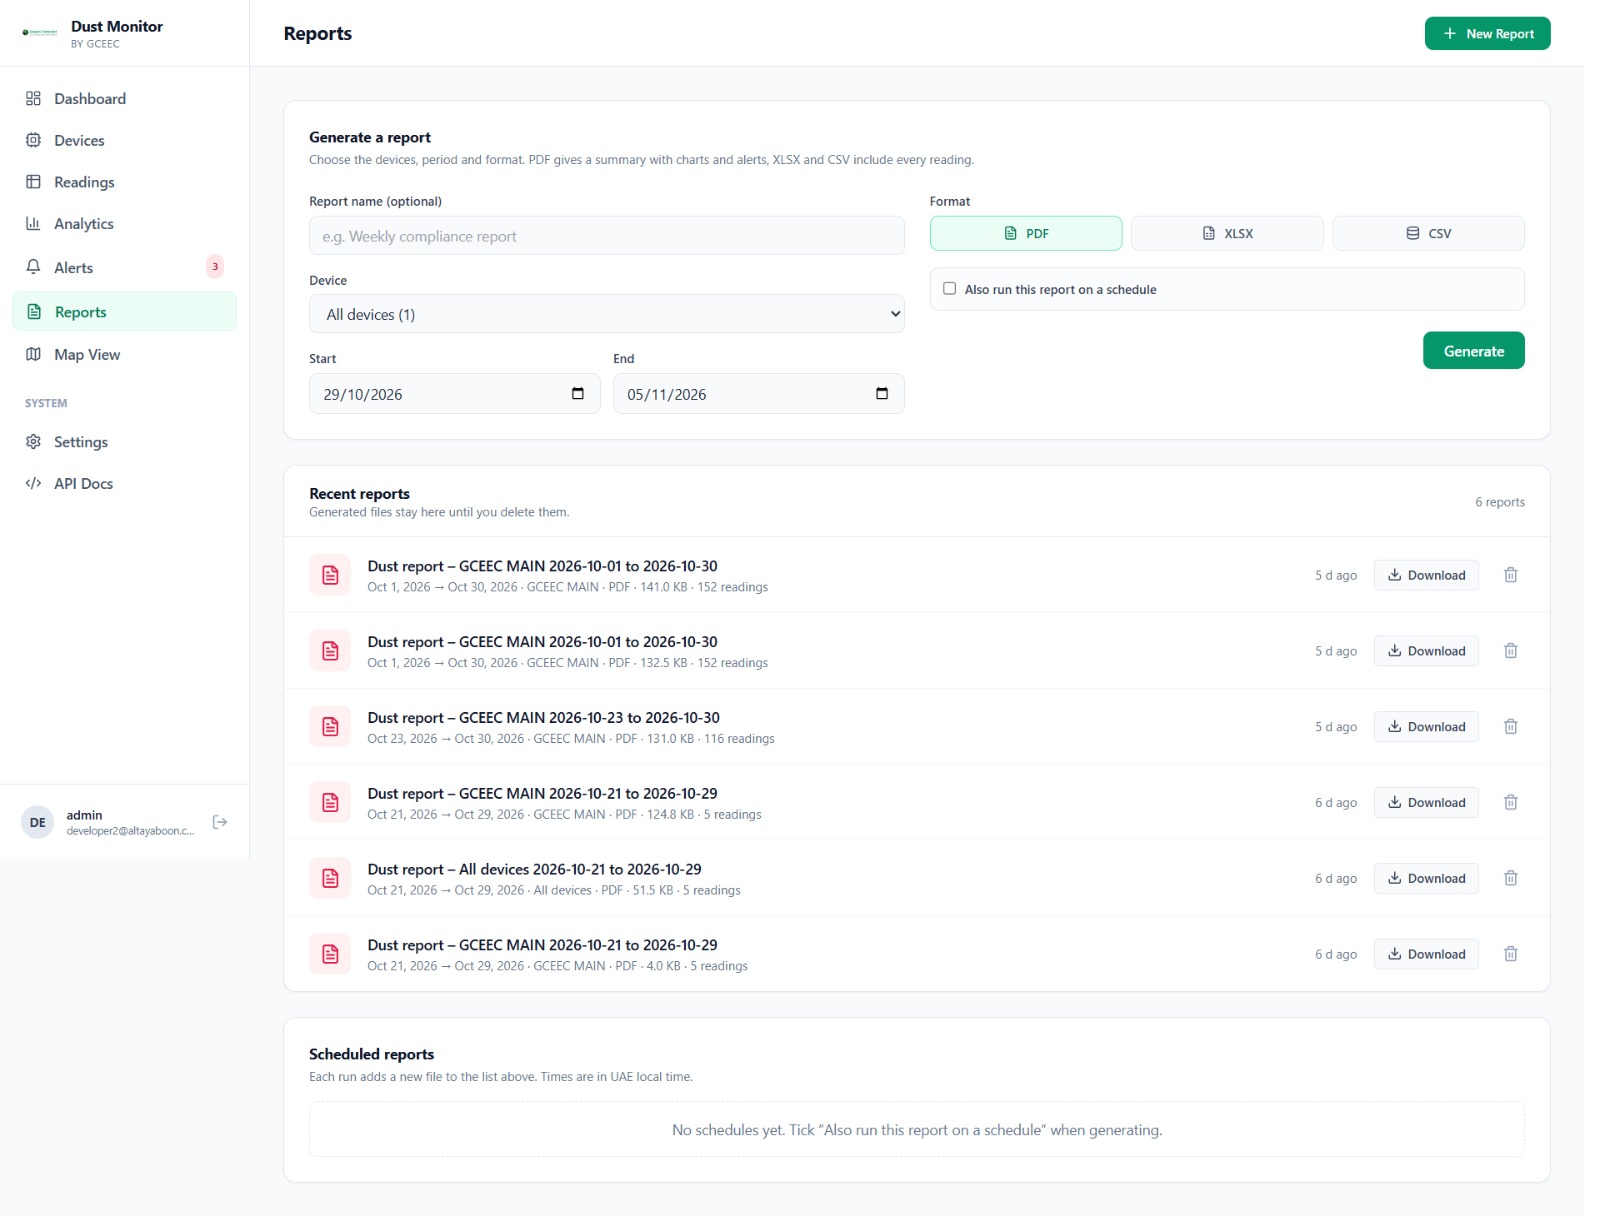
Monthly reports are generated from stored readings in the GCEEC environmental monitoring format, with charts, compliance tables and annexures, and can run on a schedule so they are ready before they are due.
Group or main-contractor HSE teams see every station on one map and one dashboard, with user accounts scoped to their own company. Add a site by registering a device, not by starting a new system.
Seven modules share one data store. A reading that arrives from a station is on the dashboard, in analytics, checked against alert rules and available to reports within the same minute.
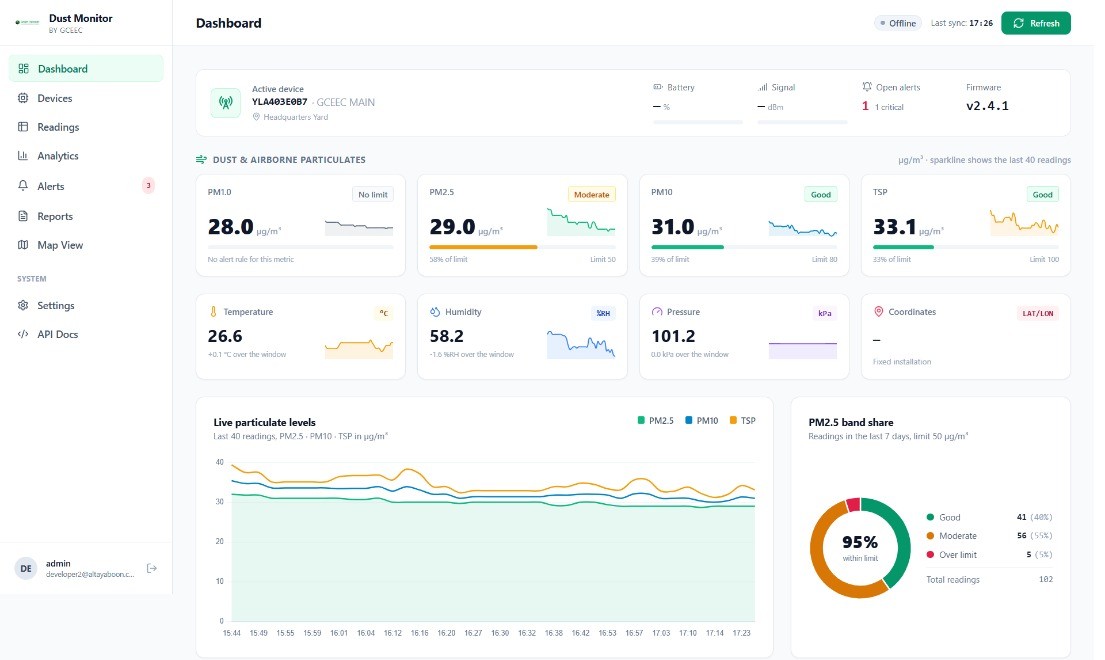
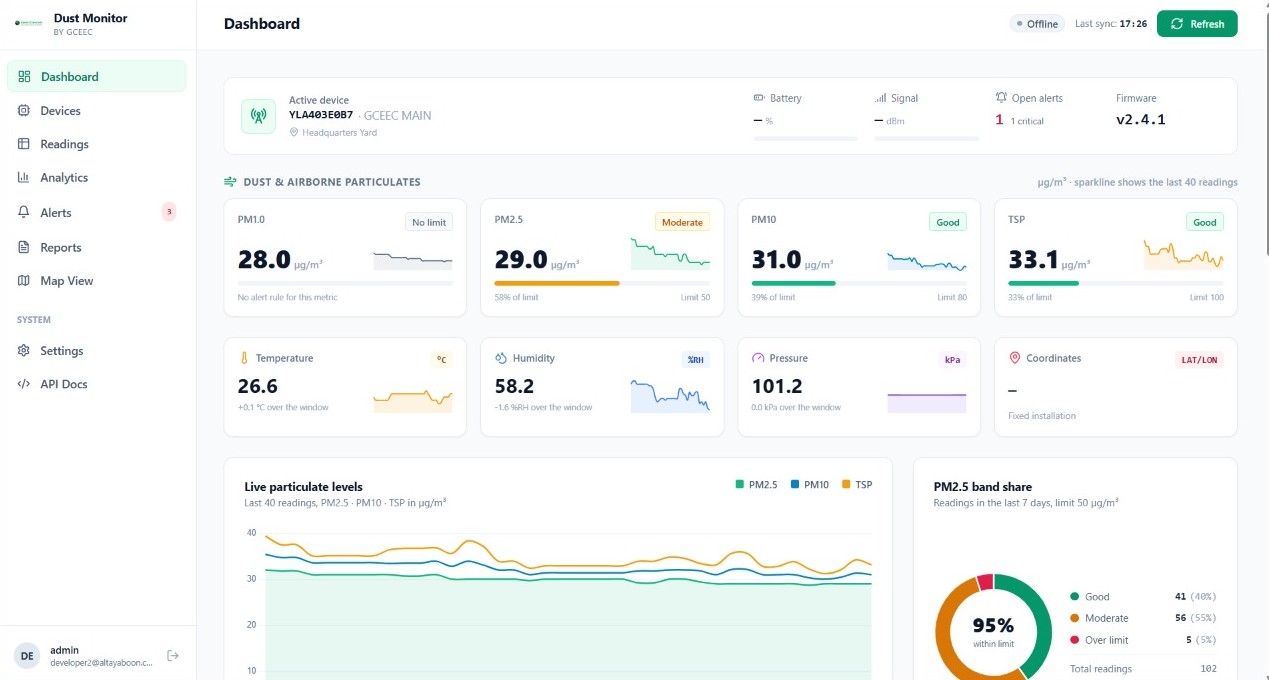
Each station has a header card with battery, signal, firmware and open alerts, followed by one tile per metric showing the current value, a sparkline of the last 40 readings and how far it sits from its limit.
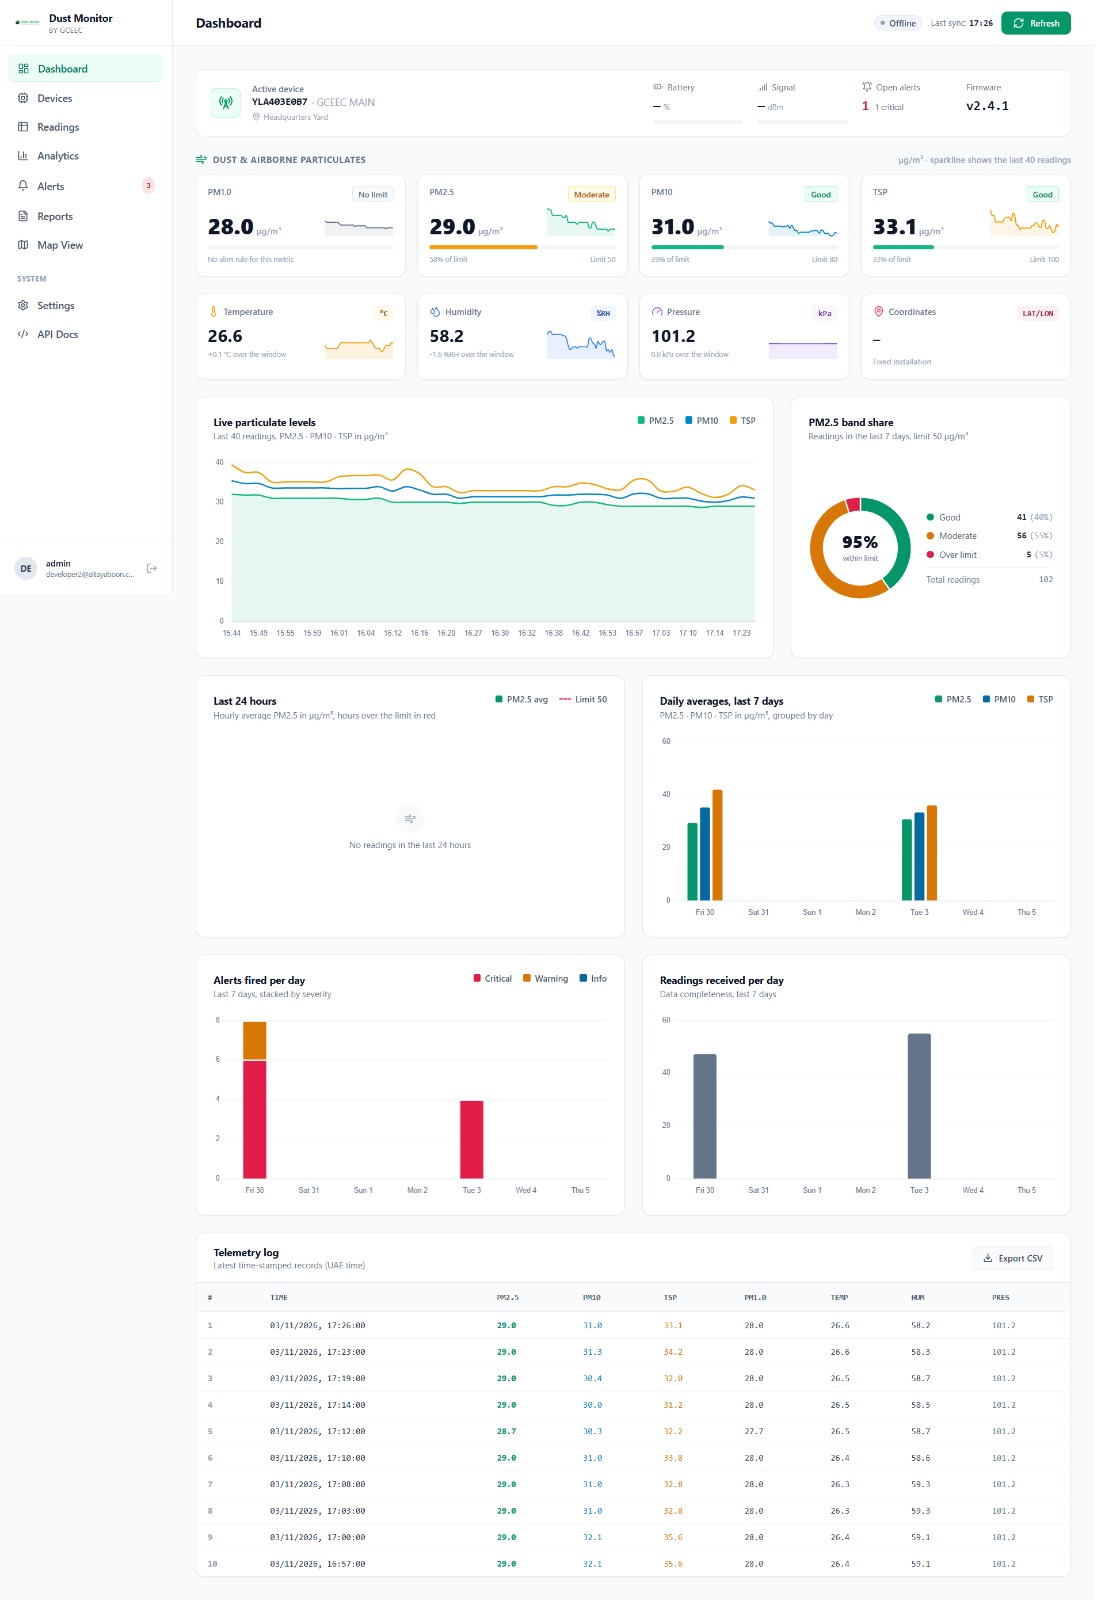
Analytics works on 24-hour, 7-day, 30-day and 90-day windows across all stations of a company, so the question changes from "what is the reading" to "what on this site is producing it".
An alert rule is a metric, an operator, a threshold, a hold duration and a severity. The alert engine evaluates every enabled rule against the newest reading of every station on a 30-second cycle. When a condition holds for the duration you set, an alert opens; when it clears, the alert resolves itself and the whole episode is kept.
Choose the stations, the period and the format. PDF gives a summary with charts, compliance tables and alerts in the GCEEC environmental monitoring report layout. XLSX and CSV include every reading for your own analysis or for submission to a client system.
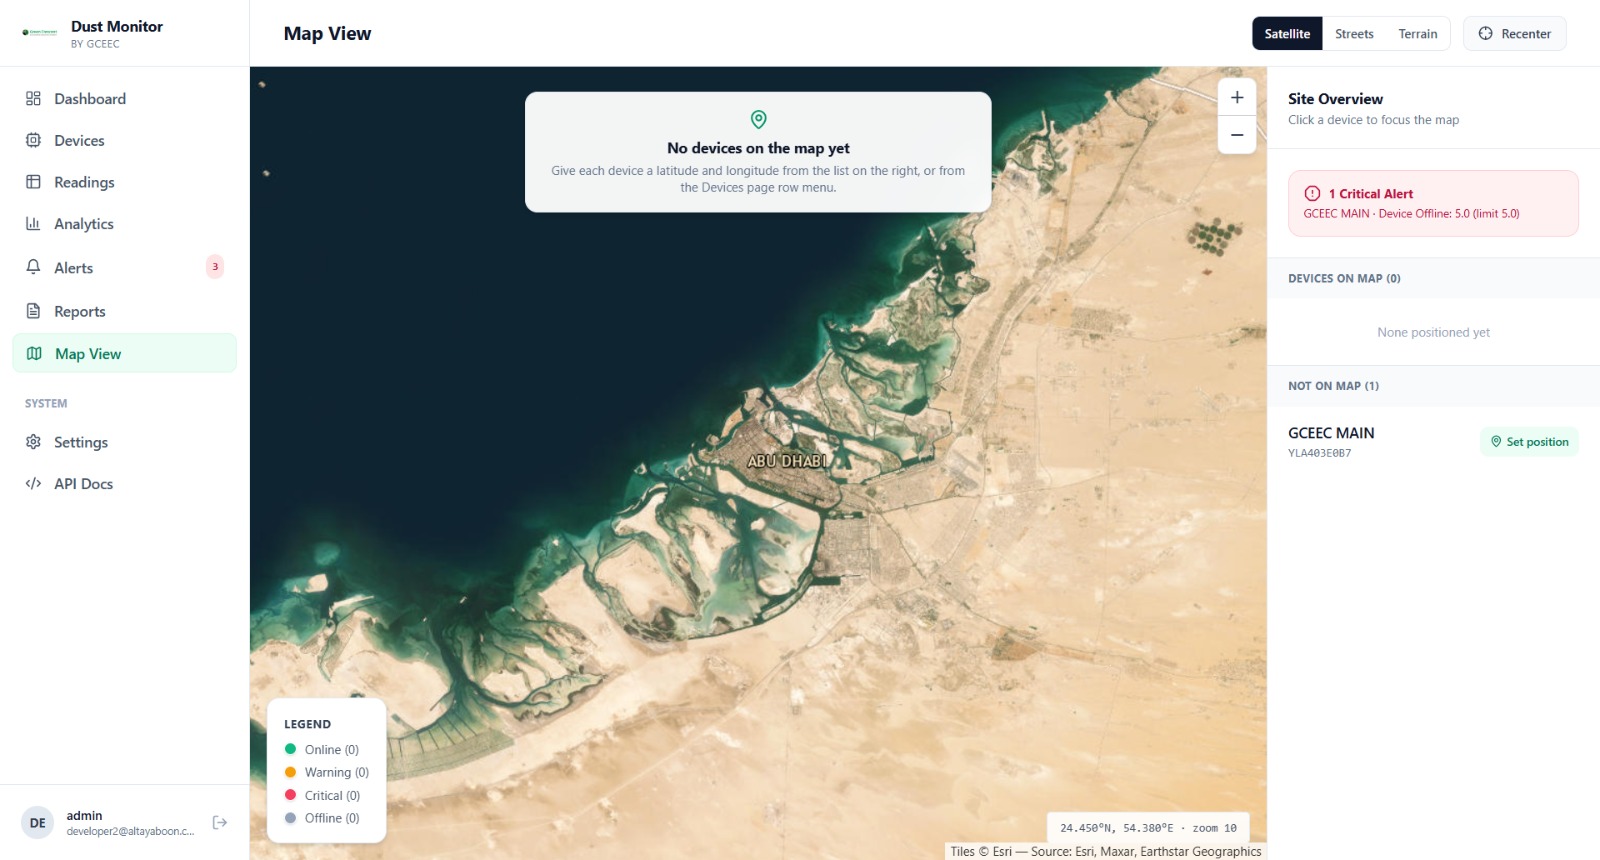
Stations are placed by the coordinates they report or by a position you set. Markers carry the station's status, so a regional HSE manager sees which sites are online, in warning or in critical without opening each one.
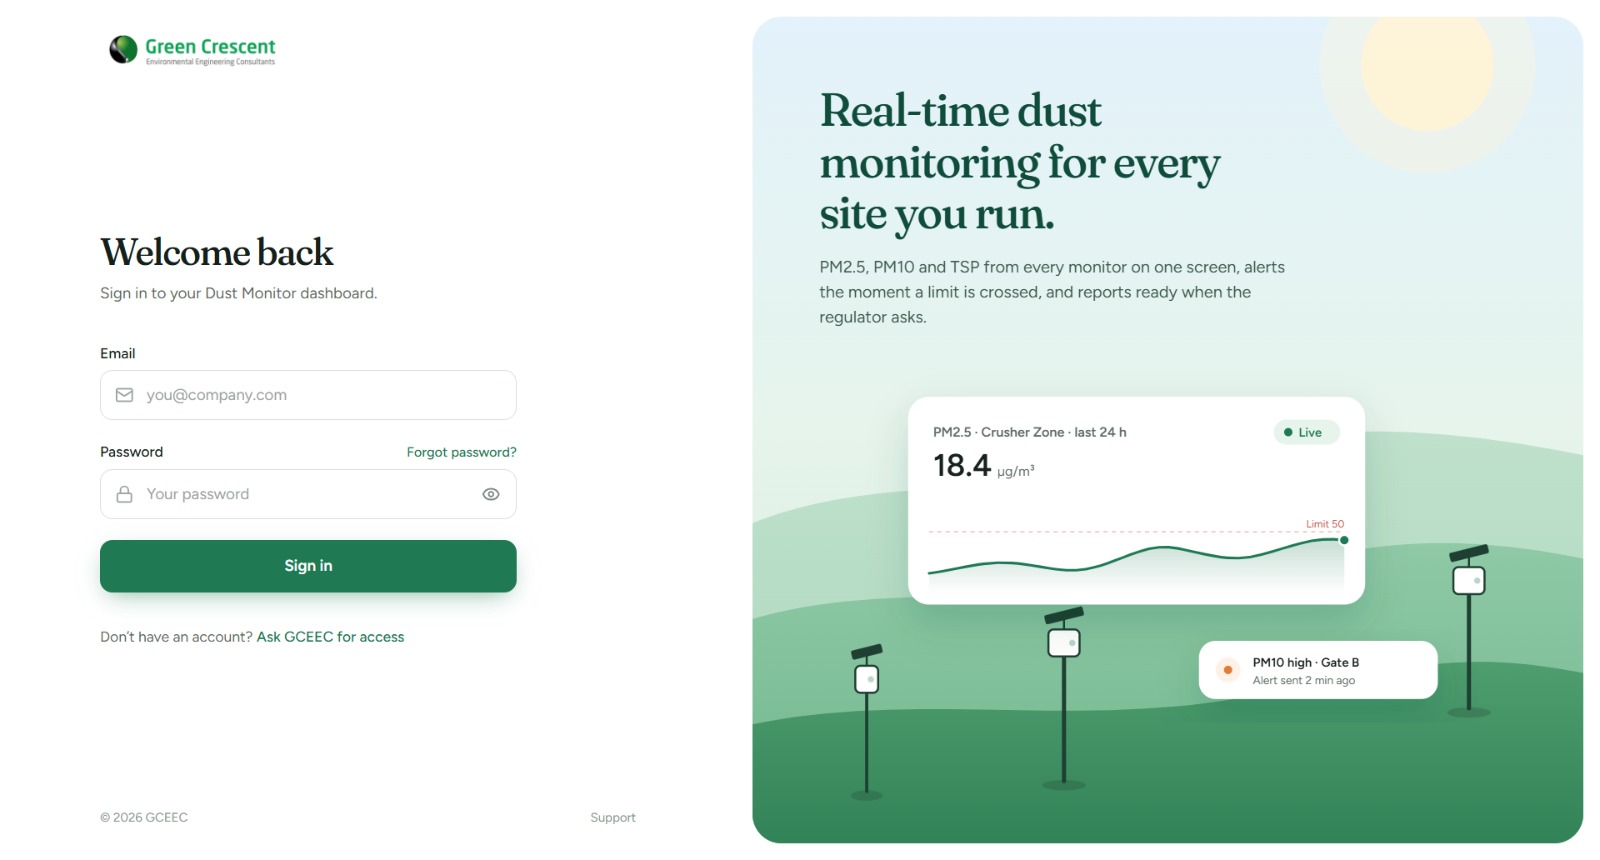
Devices are registered to a company with a serial, a name and a location. Users belong to that company and see only its stations, alerts and reports. GCEEC registers each station and issues the user accounts, so a new site is ready to view on the day it is installed.
Compliance in the reports is assessed on 24-hour daily averages against the standard configured for the project. The defaults follow the ambient air quality limits commonly applied in the UAE, and GCEEC sets project-specific limits where a permit, an EIA condition or a client specification requires them.
Dust Monitor is sold with the stations, not as software alone. GCEEC's monitoring team handles siting, commissioning and calibration checks, and remains the consultant of record for the project.
We review the permit conditions, the activities on site, prevailing wind and sensitive receptors, and recommend the number and position of stations.
Stations are delivered, mounted, powered and connected. Each is registered to your company account with its own key pair before it leaves our hands.
Limits, alert rules, channels and report schedules are set to your project. Site and HSE users receive their logins and a short walkthrough.
Readings flow continuously. Reports generate on schedule, and GCEEC prepares the periodic submissions where the project requires an approved consultant.
In many cases, yes. GCEEC reviews the make and model of the existing monitors and, where they can be connected, registers them to your company account. For monitors that only output serial or Modbus data, GCEEC can supply a gateway.
You do. Readings, alerts and reports belong to your company account and can be exported in full as CSV or XLSX at any time. GCEEC accesses the account only as your consultant and with your authorisation.
There is no fixed ceiling. Group accounts with stations across several emirates and dozens of users run on the same installation. Users see only the stations and reports of their own company.
The device-offline rule opens an alert after the silence you configure, and the dashboard header shows the last sync time. Data availability is reported alongside the readings so gaps are visible rather than hidden in an average.
The PDF follows the GCEEC environmental monitoring report format we already submit for clients across the UAE. Where the authority has a specific template or requires an approved consultant's stamp, GCEEC prepares and signs the submission from the same data.
Tell us where you operate and what your permit asks for. A member of GCEEC's monitoring team will walk you through the platform on a live account and prepare a proposal covering stations, installation and the software subscription.